
Inbal Arnon, Simon Kirby, Jenny A. Allen, Claire Garrigue, Emma L. Carroll, Ellen C. Garland
Humpback whale song is a culturally transmitted behavior. Human language, which is also culturally transmitted, has statistically coherent parts whose frequency distribution follows a power law. These properties facilitate learning and may therefore arise because of their contribution to the faithful transmission of language over multiple cultural generations. If so, we would expect to find them in other culturally transmitted systems. In this study, we applied methods based on infant speech segmentation to 8 years of humpback recordings, uncovering in whale song the same statistical structure that is a hallmark of human language. This commonality, in two evolutionarily distant species, points to the role of learning and cultural transmission in the emergence of properties thought to be unique to human language.
Human language has properties that make it unique among the communicative behaviors of our nearest relatives. Every human language consists of statistical ly coherent parts, such as words, where elements within those parts are relatively predictable. Across languages, few of these parts are highly frequent, many are infrequent, and there is a power law relation between frequency and rank [called a Zipfian distribution (1, 2)]. The presence of such a distribution in nonhuman communication is debated, with few studies showing a fit similar to human language (3) and most only achieving a fit to a more convex distribution [known as Zipf Mandelbrot (4–9)]. Having statistically coherent parts and having them follow a Zipfian distribution facilitates various aspects of human language learning(10–15). Much work has demonstrated that language characteristics that aid learning can arise through cultural transmission, as language is a sequential behavior that is repeatedly learned and used by multiple generations (16–18). Indeed, a re cent experimental study demonstrated that cultural transmission can promote both properties (statistically coherent parts and their Zipfian distribution) in humans (19). This raises the possibility that the statistical structure that is a hallmark of human language may exist in other species whose communication systems are culturally transmitted and involve complex sequential behavior. Humpback whale song has these properties (20–23): It is among the most complex acoustic displays in the animal kingdom and is culturally transmitted, making it an excellent model to test the impact of culture on foundational properties of human language.
Humpback whale song is long, repetitive, complex, and structured in a nested hierarchy (24, 25). Individual “sound elements” are sung in a stereotyped “phrase,” which is repeated multiple times to create a “theme”(24). Several themes are sung in a stereotyped sequence to form a “song,” with multiple songs making up a “song session” (24). Only males sing (26), and there is strong cultural conformity to the current song arrangement by most males within a population (27). However, the song also constantly changes within a season, progressively leading to a different song after a few years through theme turnover (22). In contrast to this slow change, song revolutions also occur when the entire song arrangement is rapidly and completely replaced by a song introduced from a neighboring population (20, 21). This whole sale change is notable; multiple song revolutions have been documented spreading eastwards across the South Pacific (21, 28, 29).
Understanding how humpback whales learn their song is extremely challenging given the inability to conduct laboratory experiments on these wild, free-ranging animals. However, recent work on hybrid songs, where a whale was recorded in the process of changing his song during a song revolution, has provided invaluable data on how songs are learned (30). Sequence analyses (31) revealed that songs are learned as segments (complete themes), akin to birdsong and human language learning. Revolutionary themes were spliced into the song at the position of highest structural similarity (“switch when similar” rule), allowing songs to be combined in predictable ways (30). Such studies indicate that songs are learned, and they suggest that whale song exhibits sequential structure and that this structure is relied on during cultural transmission.
If the emergence of the statistical structure found in human language is driven by it being learned and culturally transmitted, we may expect to find similar structure in whale song. We predicted that (i) statistically coherent sub sequences will be present in whale song and (ii) the distribution of these subsequences will follow a language-like power-law distribution. We tested these predictions by applying an infant-inspired segmentation method (19) to analyze 8 years of humpback whale song from a single population. Our method detects dips in transitional probability between the basic acoustic building blocks in humpback whale song (sound elements), uses them to segment the song into subsequences, and looks at the distribution of those subsequences. These are the same cues used by human infants to segment speech (32, 33): Because words are statistically coherent, transitional probabilities within words are higher (on average) than those between words. Our method does not assume learners are looking to build a lexicon, an assumption that cannot be reasonably applied to whales.
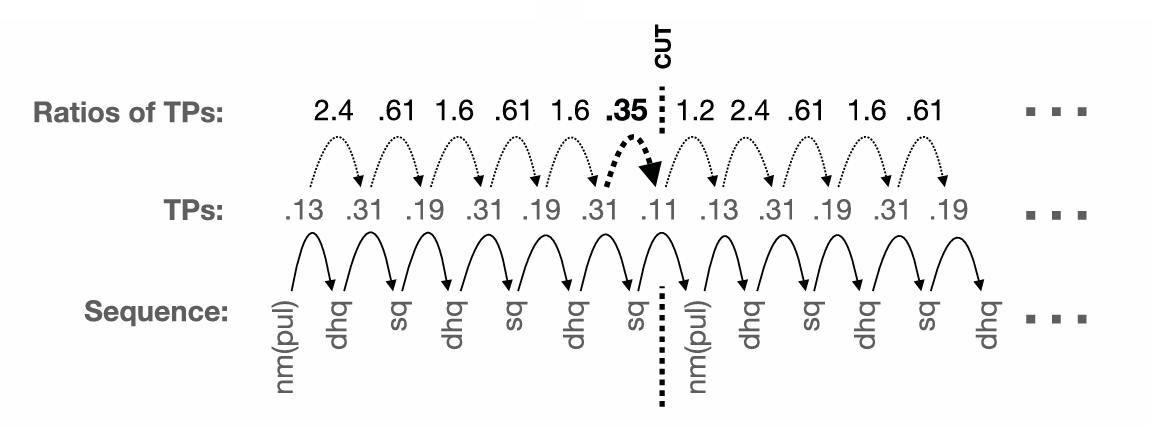
Fig. 1. An example of our infant-inspired segmentation method applied to whale song data. This is the start of one recording taken in 2017. For each year, we created a long sequence of sound elements (bottom row). We then used all the recordings from a particular year to estimate the transitional probabilities (TPs) between all pairs of sound elements (middle row). Next, we computed the ratios between subsequent TPs (top row) to find ones that merit segmentation. One ratio, shown in bold, is below 0.5, indicating a big dip in TP—in other words, the next sound element is unexpected in context. We used these dips as cues to “cut” the sequence, leading to the addition of a subsequence (i.e., sequence of elements) to the set of units we infer for that year. In the example above, we would add the subsequence nm(pul)-dhq-sq-dhq-sq-dhq-sq to the units inferred for 2017 [nm(pul) is a pulsed n-shaped moan, dhq is a descending high squeak, and sq is a squeak; see table S3].
Subsequences found in whale song follow a Zipfian distribution
If whale song, like human language, contains statistically coherent parts, we should detect local dips in transitional probability. To identify such dips, we estimated the transitional probability between each two consecutive sound elements in a given year. For example, if the song contained the sequence “grunt,” “grunt,” “ascending moan,” we estimated the probability of “grunt” coming after “grunt” in the entire song. Segmentation boundaries were inferred, following previous work, on the basis of the ratio between consecutive transitional probabilities (19). We inferred a segmentation boundary when that ratio was “unusually low.” We used the ratios and not the transitional probabilities per se to capture relative dips: A transitional probability of 0.45 may not be very low; however, a drop from 0.95 to 0.45 would indicate a meaningful drop. There is no a priori reason for setting the threshold at a particular point: given that whale song is hierarchically structured (24), different settings of the cutting parameter may discover different types of units (themes, phrases).
Previous work (19) applying a similar segmentation method to data from human participants used a threshold of 0.425 to detect a boundary. This threshold was derived from a random baseline that was similar to the structured output participants produced. However, we could not derive such a random baseline for whale song data. Instead, we chose a 0.5 threshold, similar to that used with human experimental data. That is, we cut whenever the current transition was half that of the prior one, suggesting that the next sound element was unexpected in context. Figure 1 illustrates our segmentation method for a 2017 song sequence. Notably, we repeated the analyses with two additional thresholds of 0.25 and 0.75 and show that the results are robust to changes in cutting sensitivity (see figs. S1 to S4). In other words, despite differences in how many units are detected, we find the same statistical structure at different unit sizes, as expected if changing the threshold leads to detecting a larger subset of the existing units.
We ran this segmentation pipeline for each year separately (as song content differs across years). Each year’s data included multiple separate recordings (table S1). Sound elements from each recording were concatenated after removing (human-assigned) theme and song cycle boundaries. Our method detected sub sequences within the song: We performed an average of 1562 cuts on the data from each year. For each year, we calculated the frequency of each of the segmented subsequences (table S2). Figure 2A plots the frequency distribution of the segmented units, collapsed across the years. The distribution shows an excellent fit to a power law(meanR2=0.93,Pearsonproduct moment correlation). That is, applying a segmentation method based on infant language learning to whale song resulted in the detection of subsequences that follow a Zipfian distribution.
To ensure that the Zipfian distribution is not dependent on our particular segmentation method, we implemented two additional segmentation pipelines, both of which rely on cues used by infants and do not assume a lexicon. One expands the sequential context (using the transitional probabilities based on the two previous sound elements), and the second uses backward transitional probability (the probability of each sound element given the one that follows). This last pipeline is a particularly good validation be cause infants also use backward transitional probabilities in segmenting speech (34). The resulting distribution of subsequences using these additional infant-inspired methods also showed an excellent fit to a Zipfian distribution [R2 =0.93(fig.S5)andR2 = 0.94 (fig. S6), respectively].
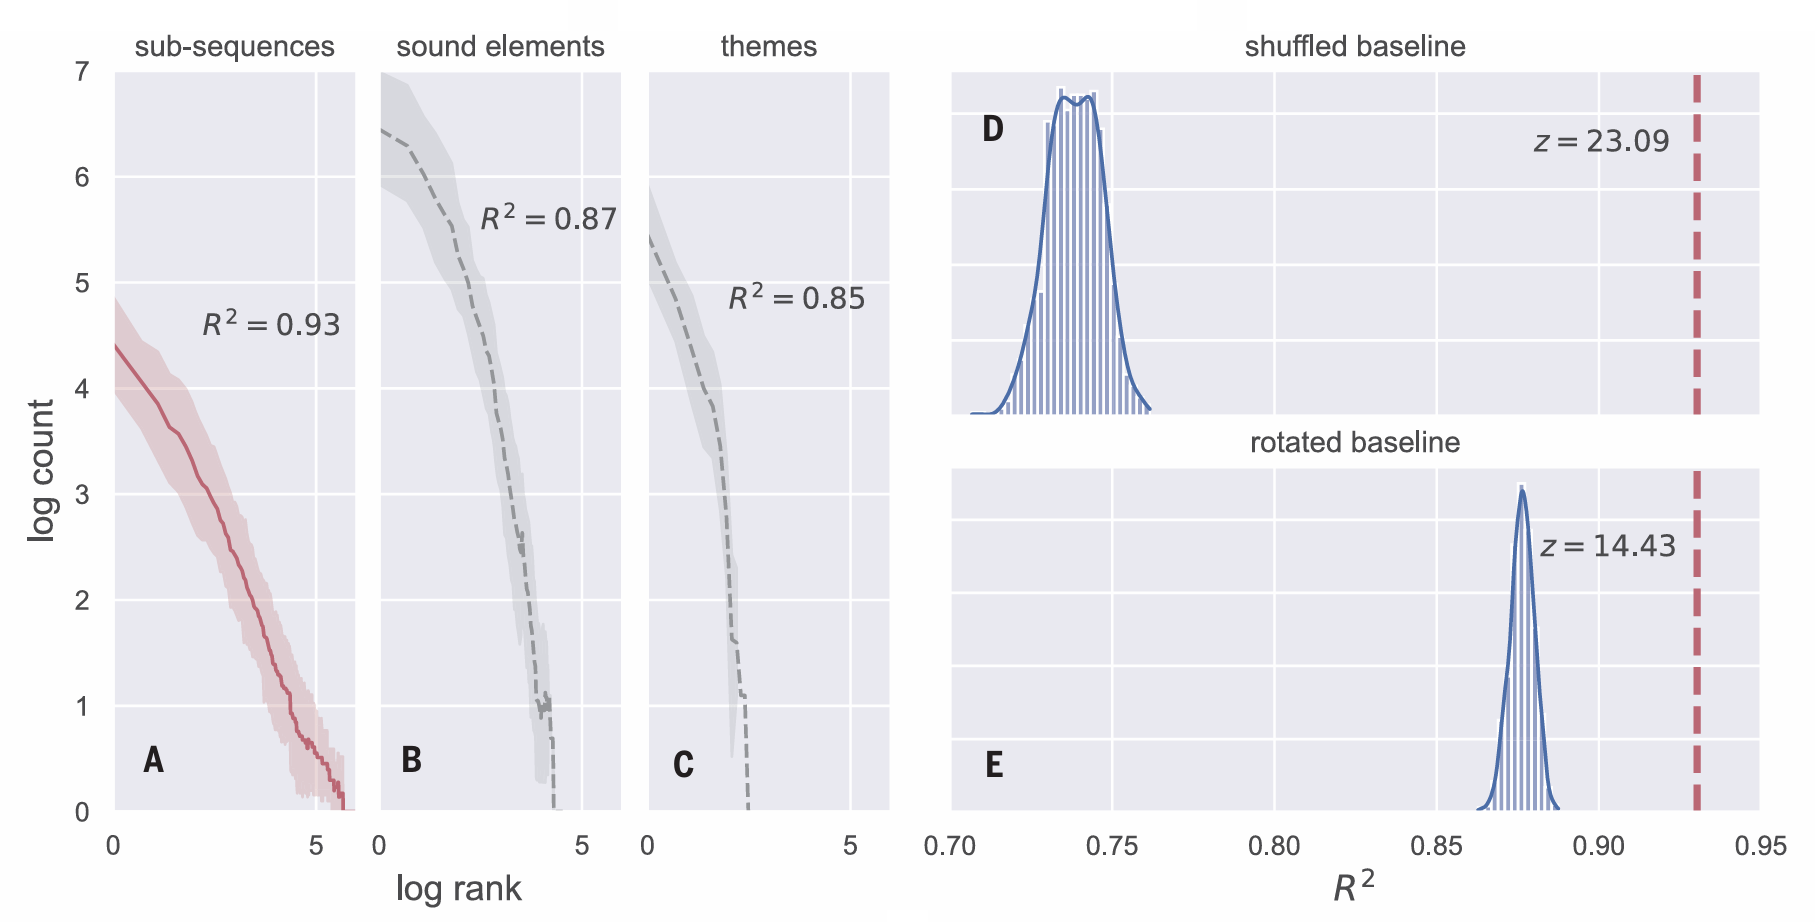 Fig. 2. Subsequences detected by our infant-inspired segmentation
method in humpback whale song follow a Zipfian frequency distribution.
(A) The frequency of each subsequence ordered by rank, plotted on a log scale
for both axes. There is a small number of highly frequent subsequences and
a long tail of low-frequency ones. We calculated the frequency of the subsequences
independently for each year and then aggregated the frequency by rank over the
eight different years (we show the mean and 95% bootstrapped confidence
intervals around the mean). The straight line is diagnostic of a power law
distribution that is typical of word frequency distributions in human languages.
(B) The same plot, but based on the distribution of the individual sound elements
(the basic acoustic building blocks of whale song). The distribution is skewed but shows less of a fit to a power law than the distribution of subsequences in
(A). (C) The distribution of the human categorized “themes” (55) in the dataset.
For each distribution in (A) to (C), the mean R2 value is shown. This indicates
how well the distribution fits a power law. The best fit for a Zipfian distribution is
found for units detected using our infant-inspired method. (D and E) Comparison
of the Zipfian fit of our detected subsequences to two baselines. The dashed
lines indicate the R2 for the real data. The histogram in (D) shows the distribution of
R2 values derived by running our full segmentation pipeline on 1000 randomly
shuffled datasets. The histogram in (E) shows the distribution of R2 values for
1000 randomly rotated datasets. The z-scores demonstrate that the real data are
a far better fit to a Zipfian distribution than any of the baseline datasets.
Fig. 2. Subsequences detected by our infant-inspired segmentation
method in humpback whale song follow a Zipfian frequency distribution.
(A) The frequency of each subsequence ordered by rank, plotted on a log scale
for both axes. There is a small number of highly frequent subsequences and
a long tail of low-frequency ones. We calculated the frequency of the subsequences
independently for each year and then aggregated the frequency by rank over the
eight different years (we show the mean and 95% bootstrapped confidence
intervals around the mean). The straight line is diagnostic of a power law
distribution that is typical of word frequency distributions in human languages.
(B) The same plot, but based on the distribution of the individual sound elements
(the basic acoustic building blocks of whale song). The distribution is skewed but shows less of a fit to a power law than the distribution of subsequences in
(A). (C) The distribution of the human categorized “themes” (55) in the dataset.
For each distribution in (A) to (C), the mean R2 value is shown. This indicates
how well the distribution fits a power law. The best fit for a Zipfian distribution is
found for units detected using our infant-inspired method. (D and E) Comparison
of the Zipfian fit of our detected subsequences to two baselines. The dashed
lines indicate the R2 for the real data. The histogram in (D) shows the distribution of
R2 values derived by running our full segmentation pipeline on 1000 randomly
shuffled datasets. The histogram in (E) shows the distribution of R2 values for
1000 randomly rotated datasets. The z-scores demonstrate that the real data are
a far better fit to a Zipfian distribution than any of the baseline datasets.
Zipfian distribution reflects sequential structure in whale song
We performed several validation tests to ensure that the Zipfian distribution was not an artifact of the distribution of sound elements. First, we examined the distribution of sound elements, themes, and our detected subsequences. While all three had a skewed distribution, our detected subsequences showed the best fit to a power law (Fig. 2, A to C). This alone does not rule out the possibility that the skewed distribution of sound elements by itself will lead to a Zipfian distribution of segmented subsequences. To address this, we created 1000 pseudo datasets by shuffling the sound elements within each song. This pre serves the distribution of individual sound elements but destroys any sequential structure. We then reran our segmentation pipe line with each of these 1000 shuffled datasets and calculated the R2 to capture the fit to a power law. If the statistical structure observed in whale song reflects sequential structure, the shuffled pseudo datasets should not produce the same results. Figure 2D shows that the R2 line of 0.93 derived from the real data is substantially higher than any derived from the shuffled datasets (z = 23.09, P<0.00001). We also ran this baseline analysis for the two additional segmentation pipelines mentioned above with similar results [expanded-context pipeline, z = 26, P < 0.00001 (fig. S7); backward transitional-probabilities pipeline, z = 24.67, P < 0.00001 (fig. S8)].
To further ensure that the distribution we found was related to the specific cue we used to segment the song, we performed an additional, more stringent, validation that preserved the ordering of the sound elements and the length distribution of the segmented units, but where the cuts no longer corresponded to dips in transitional probabilities. To do this, we generated 1000 “rotated” datasets by taking the cutting points from the original dataset for each year and shifting them by a random number of steps (e.g., if the random number was 5 for a particular dataset, a cut at position 10 of the sequence would now be placed in position 15). We calculated the frequency distribution of the segmented units for each “rotated” dataset. The fit to the Zipfian distribution in the real data was again significantly higher than in the rotated datasets (z = 14.43, P < 0.00001; Fig. 2E). We also ran this conservative baseline for the additional segmentation pipelines and found similar results [expanded context pipeline, z = 17.55, P < 0.00001 (fig. S9); backward-transitional-probabilities pipeline, z = 17.32, P < 0.00001 (fig. S10)].
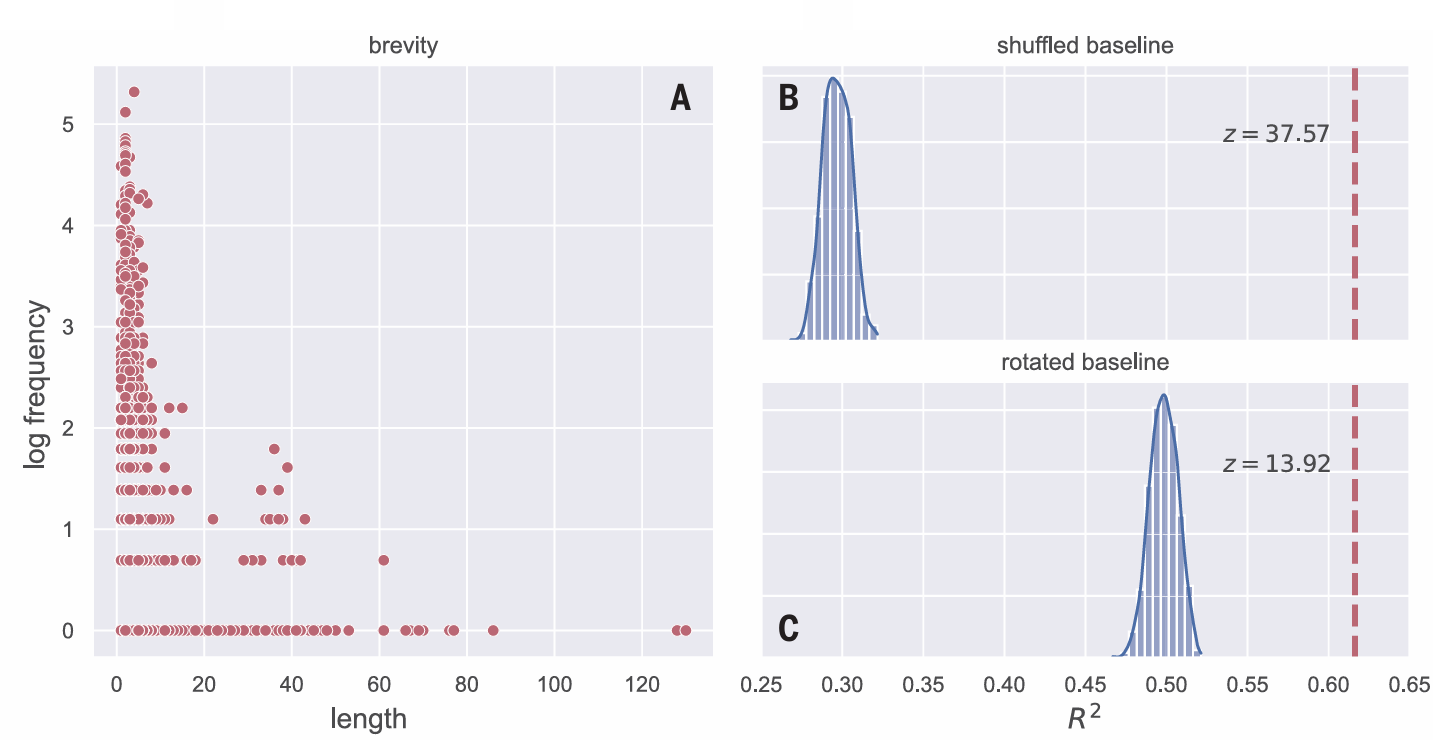 Fig. 3. Subsequences detected
by our segmentation method
follow Zipf’s law of brevity.
Each point in (A) is one sub
sequence (see table S2 for
examples of the most frequent
ones). The figure shows the
frequency distribution of all sub
sequences discovered by our
segmentation method across the
entire dataset plotted by length
(number of sound elements).
More frequent subsequences are
shorter than less frequent ones,
indicating that the detected
subsequences not only follow a
Zipfian distribution (as shown in
Fig. 2) but also follow Zipf’s
second law, the law of brevity, that
is typical of human language and
other animal communication systems. (B and C) Comparison of the R2 of the real data (0.62, shown with a dashed line) to two random baselines. The histogram
in (B) shows the distribution of R2 values for the relation between frequency and length derived by running our full segmentation method on 1000 randomly
shuffled datasets. The histogram in (C) shows the distribution of R2 values for 1000 randomly rotated datasets. The z-scores demonstrate that the real data are a far
better fit to Zipf’s law of brevity than any of the baseline datasets.
Fig. 3. Subsequences detected
by our segmentation method
follow Zipf’s law of brevity.
Each point in (A) is one sub
sequence (see table S2 for
examples of the most frequent
ones). The figure shows the
frequency distribution of all sub
sequences discovered by our
segmentation method across the
entire dataset plotted by length
(number of sound elements).
More frequent subsequences are
shorter than less frequent ones,
indicating that the detected
subsequences not only follow a
Zipfian distribution (as shown in
Fig. 2) but also follow Zipf’s
second law, the law of brevity, that
is typical of human language and
other animal communication systems. (B and C) Comparison of the R2 of the real data (0.62, shown with a dashed line) to two random baselines. The histogram
in (B) shows the distribution of R2 values for the relation between frequency and length derived by running our full segmentation method on 1000 randomly
shuffled datasets. The histogram in (C) shows the distribution of R2 values for 1000 randomly rotated datasets. The z-scores demonstrate that the real data are a far
better fit to Zipf’s law of brevity than any of the baseline datasets.
Subsequences found in whale song follow
Zipf’s law of brevity
Zipf also demonstrated that frequent words tend to be shorter than infrequent words, a concept known as Zipf’s law of brevity (2). This relationship between length and frequency is demonstrated in a range of species (35–37), is taken as evidence for compression (35), and is seen as a result of adaptation for communicative efficiency (38). If our method for discovering subsequences is capturing units that are relevant for whales, we might expect the subsequences we find to have lengths that reflect Zipf’s law of brevity. Indeed, Fig. 3A shows a strong relation ship between length and log frequency (R2 = 0.62). As above, we ran the shuffled and rotated baselines to ensure that the pattern we found was not an artifact. The fit to Zipf’s law of brevity in the real data was vastly better than the fit of the two baseline sets [1000 shuffled datasets: z = 37.57, P < 0.00001 (Fig. 3B); 1000 rotated datasets: z = 13.92, P < 0.00001 (Fig. 3C)]. We also ran the same base line analyses for the other two segmentation pipelines, with similar results (figs. S11 and S14) [expanded-context pipeline, shuffled base line, z = 53.09, P < 0.00001 (fig. S12); rotated baseline, z = 18.61, P < 0.00001 (fig. S13); backward-transitional-probabilities pipeline, shuffled baseline, z = 45.46, P < 0.00001 (fig. S15); rotated baseline, z = 19.32, P < 0.00001 (fig. S16)]. These analyses clearly show that Zipf’s law of brevity is a feature of whale song that holds for subsequences detected using several infant-inspired segmentation methods.
Discussion
Uncovering precisely how whales learn their songs is a challenging, potentially intractable, problem. Laboratory experiments such as those done with human infants are clearly impossible in this species. However, we can apply infant inspired techniques to the songs of humpback whales. Doing so reveals hitherto hidden structure in whale song. We detected statistically coherent subsequences: a characteristic de sign feature shared with human language. The frequency of these subsequences closely follows a Zipfian distribution—this, too, is a property found in all human languages. Finally, the length of the detected subsequences follows Zipf’s second law, the law of brevity. Frequent units tend to be shorter than less frequent ones. Once again, this property is found in all human languages. This work reveals a deep commonality between two unrelated species united by the fact that their communication systems are culturally transmitted.
One concern might be that the Zipfian distribution of the detected subsequences is an inevitable artifact of the distribution of the basic sound elements, or of our segmentation procedure, and that such a distribution will be found whenever cuts are made. However, two baseline analyses show this to be unlikely. Neither our shuffled dataset nor our rotated dataset had a fit close to the one found in the real whale data(Fig. 2, D and E). Equally, the fit to a Zipfian distribution is not as strong when using human-annotated units (sound elements, themes; Fig. 2, B and C). The subsequences extracted with our method also follow Zipf’s law of brevity, another linguistic universal (39–41), suggesting that we are detecting units relevant to the whales (Fig. 3). Zipf’s law of brevity is found in a range of species (35,37), including humans (42), and likely arises from optimizing efficient coding (2, 38, 40). The fact that using transitional probabilities led us to detect units that follow this law suggests that humpback whales, like human infants, may learn their song by tracking transitional probabilities between elements, and using dips in those probabilities as a cue for unit boundary (32).
Our infant-inspired method relies on transitional probabilities as a cue to segmentation. This cue is not expected to provide the most accurate segmentation for natural language, as language has multiple probabilistic cues to segmentation. Instead, we wanted to simulate early learning, relying on cues actually used by infants without making additional assumptions about the learner. Indeed, transitional probabilities have been used to extract word candidates from child-directed speech (43, 44) and are used by infants early on (32, 33), be fore the use of other cues such as stress (45). To ensure that the results were not dependent on this particular method, we implemented two additional infant-inspired segmentation methods, both of which resulted in the detection of subsequences whose frequency showed a very good fit to the Zipfian distribution (figs. S5 to S10). These converging findings present evidence that Zipfian distributions are found in whale song when using infant-inspired methods to detect units.
Of course, there are many differences be tween whale song and human language. Above all, expressions in language have semantic con tent. The meaning of sentences is composed of the meanings of the parts and how they are put together. We make no such claim for whale song. We have little understanding of the “meaning” of the songs, let alone the different units, for humpback whales. Furthermore, having similar statistical structure does not entail similar expressive function. In fact, similar statistical structure is also found in music—a culturally transmitted behavior where individual units do not have explicit expressive meaning but nevertheless show a good fit to a Zipfian distribution (46). While there are multiple explanations for the presence of Zipfian distributions in human language [see (1) for a review], only a subset of them seem relevant for the analysis of whale song. Existing accounts (for human language) can be broadly divided into ones pertaining to the coding of meaning (36, 41, 47, 48), to communicative efficiency (38, 49), and to learnability (11, 50). As discussed above, it is unlikely that explanations pertaining to meaning are relevant for whale song (5, 23, 51), leaving efficiency and learnability explanations as the most relevant.
Our work is by no means the first to look for linguistic laws in nonhuman communication (52, 53). Indeed, much work has specifically focused on Zipfian distributions. However, as noted above, the vast majority of studies have only found a fit to Zipf-Mandelbrot’s extension, which has an additional parameter, and will necessarily fit a wider range of data. These findings could be, and sometimes are, interpreted to reflect a meaningful difference between hu man language and nonhuman communication (5). Alternatively, they could arise from the choice of “units” being counted, as we have seen here; counting individual sound elements in whale song leads to a Zipf-Mandelbrot distribution (Fig. 2B) (5), whereas counting sub sequences detected using our segmentation method reveals a pure Zipfian distribution. This leads to a strong prediction that applying our infant-inspired segmentation method will lead to a similar shift from Zipf-Mandelbrot to Zipf in species with learned sequential signals. Song birds provide a particularly promising model to explore this prediction, as multiple passerine species have culturally transmitted songs and several show a good fit to the Zipf-Mandelbrot distribution [e.g., (6–8)]. Some, including house finches (Haemorhous mexicanus) and zebra finches (Taeniopygia guttata), are also sensitive to transitional probabilities in learning (8, 54).
We have revealed a deep commonality be tween two unrelated, evolutionarily distant species, humans and humpback whales, united by the cultural transmission of their communication systems. This points to the crucial role of learning and transmission in the emergence of structure within such systems. Whether the units detected by our infant-inspired segmentation method are salient to the whales them selves remains an open question. These findings also raise the intriguing possibility that similar statistical structure will be found wherever com plex sequential behavior is transmitted culturally, and they suggest that our understanding of the evolution of language can benefit from looking not only at our closest primate relatives but also at cases of convergent evolution elsewhere in nature. We can do this by looking beyond the proximate functions of language, for example, as a system conveying semantic in formation, and instead consider how language is learned and transmitted culturally over multiple generations. Once thought of as the hallmark of human uniqueness, it may transpire that foundational aspects of human language are shared across species.
REFERENCES AND NOTES 1. S. T. Piantadosi, Psychon. Bull. Rev. 21, 1112–1130 (2014). 2. G. Zipf, Human Behavior and the Principle of Least Effort: An Introduction to Human Ecology (Addison-Wesley Press, 1949). 3. B. McCowan, S. F. Hanser, L. R. Doyle, Anim. Behav. 57, 409–419 (1999). 4. B. Mandelbrot, Commun. Theory 84, 486–502 (1953). 5. J. A. Allen, E. C. Garland, R. A. Dunlop, M. J. Noad, Proc. Biol. Sci. 286, 20192014 (2019). 6. E. Briefer, T. S. Osiejuk, F. Rybak, T. Aubin, J. Theor. Biol. 262, 151–164 (2010). 7. M. L. Cody, E. Stabler, H. M. Sánchez Castellanos, C. E. Taylor, Bioacoustics 25, 41–54 (2016). 8. M. Youngblood, Proc. Biol. Sci. 291, 20240250 (2024). 9. J. P. Hailman, M. S. Ficken, R. W. Ficken, Semiotica 56, 191–224 (1985). 10. C. Kurumada, S. C. Meylan, M. C. Frank, Cognition 127, 439–453 (2013). 11. O. Lavi-Rotbain, I. Arnon, Cognition 223, 105038 (2022). 12. A. T. Hendrickson, A. Perfors, Cognition 189, 11–22 (2019). 13. J. K. Boyd, A. E. Goldberg, Mod. Lang. J. 93, 418–429 (2009). 14. O. Lavi-Rotbain, I. Arnon, Cognition 206, 104492 (2021). 15. K. D. Schuler, P. A. Reeder, E. L. Newport, R. N. Aslin, Lang. Learn. Dev. 13, 357–374 (2017). 16. S. Kirby, Psychon. Bull. Rev. 24, 118–137 (2017). 17. S. Kirby, H. Cornish, K. Smith, Proc. Natl. Acad. Sci. U.S.A. 105, 10681–10686 (2008). 18. S. Kirby, M. Dowman, T. L. Griffiths, Proc. Natl. Acad. Sci. U.S.A. 104, 5241–5245 (2007). 19. I. Arnon, S. Kirby, Sci. Rep. 14, 5255 (2024). 20. M. J. Noad, D. H. Cato, M. M. Bryden, M.-N. Jenner, K. C. S. Jenner, Nature 408, 537–537 (2000). 21. E. C. Garland et al., Curr. Biol. 21, 687–691 (2011). 22. K. Payne, R. S. Payne, Z. Tierpsychol. 68, 89–114 (1985). 23. E. C. Garland, C. Garrigue, M. J. Noad, Philos. Trans. R. Soc. Lond. Ser. B 377, 20200313 (2022). 24. R. S. Payne, S. McVay, Science 173, 585–597 (1971). 25. L. M. Herman, W. N. Tavolga, in Cetacean Behaviour: Mechanisms and Functions, L. M. Herman, Ed. (Wiley 1980), pp. 149–209. 26. D. A. Glockner, in Communication and Behavior of Whales, R. Payne, Ed. (Westview Press Inc., 1983), pp. 447–464. 652 7FEBRUARY2025 VOL387ISSUE6734 science.org SCIENCE RESEARCH | RESEARCHARTICLES 27. K. Payne, P. Tyack, R. Payne, in Communication and Behavior of Whales, R. Payne, Ed. (Westview Press Inc., 1983), pp. 9–57. 28. C. Owen et al., R. Soc. Open Sci. 6, 190337 (2019). 29. J. N. Schulze, J. Denkinger, J. Oña, M. M. Poole, E. C. Garland, R. Soc. Open Sci. 9, 220158 (2022). 30. E. C. Garland, L. Rendell, L. Lamoni, M. M. Poole, M. J. Noad, Proc. Natl. Acad. Sci. U.S.A. 114, 7822–7829 (2017). 31. E. C. Garland et al., J. Acoust. Soc. Am. 142, 460–472 (2017). 32. J. R. Saffran, R. N. Aslin, E. L. Newport, Science 274, 1926–1928 (1996). 33. T. Teinonen, V. Fellman, R. Näätänen, P. Alku, M. Huotilainen, BMC Neurosci. 10, 21 (2009). 34. B. Pelucchi, J. F. Hay, J. R. Saffran, Cognition 113, 244–247 (2009). 35. S. Semple, M. J. Hsu, G. Agoramoorthy, Biol. Lett. 6, 469–471 (2010). 36. L. Favaro et al., Biol. Lett. 16, 20190589 (2020). 37. M. Huang, H. Ma, C. Ma, P. A. Garber, P. Fan, Anim. Behav. 160, 145–155 (2020). 38. J. Kanwal, K. Smith, J. Culbertson, S. Kirby, Cognition 165, 45–52 (2017). 39. S. T. Piantadosi, H. Tily, E. Gibson, Proc. Natl. Acad. Sci. U.S.A. 108, 3526–3529 (2011). 40. R. Ferrer-i-Cancho et al., Cogn. Sci. 37, 1565–1578 (2013). 41. R. Ferrer-i-Cancho, C. Bentz, C. Seguin, J. Quant. Linguist. 29, 165–194 (2022). 42. C. Bentz, R. Ferrer-i-Cancho, in Proceedings of the Leiden Workshop on Capturing Phylogenetic Algorithms for Linguistics, C. Bentz, G. Jäger, I. Yanovich, Eds. (Univ. of Tubingen, 2016). 43. K. Stärk, E. Kidd, R. L. A. Frost, Lang. Speech 65,3–27 (2022). 44. A. Cristia, E. Dupoux, N. B. Ratner, M. Soderstrom, Open Mind 3, 13–22 (2019). 45. E. D. Thiessen, J. R. Saffran, Dev. Psychol. 39, 706–716 (2003). 46. B. Manaris et al., Comput. Music J. 29, 55–69 (2005). 47. R. Ferrer‐i‐Cancho, Complexity 21, 409–411 (2016). 48. D. Y. Manin, Cogn. Sci. 32, 1075–1098 (2008). 49. R. Ferrer i Cancho, R. V. Solé, Proc. Natl. Acad. Sci. U.S.A. 100, 788–791 (2003). 50. C. Bentz, D. Alikaniotis, M. Cysouw, R. Ferrer-i-Cancho, Entropy 19, 275 (2017). 51. L. M. Herman, Biol. Rev. Camb. Philos. Soc. 92, 1795–1818 (2017). 52. S. Semple, R. Ferrer-I-Cancho, M. L. Gustison, Trends Ecol. Evol. 37, 53–66 (2022). 53. P. Sharma et al., Nat. Commun. 15, 3617 (2024). 54. J. Chen, C. Ten Cate, Behav. Processes 117, 29–34 (2015). 55. J. A. Allen, E. C. Garland, C. Garrigue, R. A. Dunlop, M. J. Noad, Sci. Rep. 12, 8999 (2022).

 A massive press at Arizona State University will subject rocks to deep-Earth pressures and temperatures.